 Finance & accounting
How to Calculate ROI and Profit Margin: Formulas and Small Business Examples
How to calculate ROI step by step: the formula, annualized ROI, marketing ROI vs ROAS, payback period, and how to calculate gross, operating and net profit margin.
 Edited by Sumeet YadavFounder & editor, MSMETOOLS · fact-checked against official sources
Contents (10)
- 1. What ROI means
- 2. How to calculate ROI step by step
- 3. Worked example 1: equipment ROI
- 4. Annualized ROI: comparing investments of different lengths
- 5. Payback period: how fast you get your cash back
- 6. Marketing ROI and ROAS
- 7. How to calculate profit margin
- 8. ROI, profit margin and the DuPont link
- 9. Common ROI and margin mistakes
- 10. What to do next
Should you buy the new oven, renew the ad campaign or hire a second technician? Each one costs money now in the hope of more money later, and return on investment (ROI) is the simplest way to compare them. This guide shows you how to calculate ROI step by step, with worked examples for equipment, a cost-saving upgrade and a marketing campaign. It also covers annualized ROI, payback period and ROAS. Because ROI is only as good as the profit figure you feed it, the second half explains how to calculate profit margin: gross, operating and net, and how margin differs from markup.
Quick answer
ROI = (gain from investment − cost of investment) ÷ cost of investment × 100. Use the extra profit the investment produces (or the costs it saves), not revenue, and count all costs. For multi-year projects, convert to annualized ROI so you can compare options fairly.
Example: $18,000 oven → $30,000 of added profit and resale over 3 years = 66.7% ROI, about 18.6% a year
Payback period = cost ÷ yearly cash gain ($18,000 ÷ $9,000 = 2 years)
Marketing ROI uses gross profit from ad sales; ROAS uses revenue
Profit margin = profit ÷ revenue × 100 (gross, operating or net)
What ROI means
Return on investment measures how much you got back relative to what you put in, expressed as a percentage. A 50% ROI means every dollar invested came back as $1.50: your dollar plus 50 cents of gain. A negative ROI means you got back less than you spent.
Its strength is simplicity. One number lets you compare a $3,000 marketing test with a $60,000 equipment purchase. Its weakness is that it ignores time and risk unless you deal with them explicitly. A 50% return over one year and a 50% return over five years look identical in the basic formula, which is why this guide also covers annualized ROI and payback.
In managerial accounting, ROI is often defined at the business-unit level as income divided by the capital invested in that unit. The OpenStax managerial accounting text splits it into two parts, sales margin (income ÷ sales) multiplied by asset turnover (sales ÷ capital invested). That split, often called the DuPont view, shows there are two routes to a better return: earn more per sale, or squeeze more sales out of each dollar tied up in the business. We come back to it in the profit margin section.
How to calculate ROI step by step
The formula is short. The judgment is in the inputs.
Calculate ROI in five steps
- 1
Add up the full cost
Include purchase price, delivery, installation, training, software, financing fees and any extra running costs. For a campaign, include agency fees and creative, not just ad spend.
Tip: Owner and staff time is a real cost. Price it at what you'd pay someone else.
- 2
Measure the gain as profit
Use the extra contribution margin or the costs saved, not extra revenue. Add any resale or salvage value at the end.
- 3
Fix the time period
Use the asset's useful life or a realistic horizon, such as 3 years for equipment or the campaign period plus repeat purchases for marketing.
- 4
Apply the formula
ROI = (total gain − total cost) ÷ total cost × 100.
- 5
Put it in context
Annualize multi-year returns, check the payback period and compare with your cost of borrowing and the next-best option.
Why "gain" must mean profit, not sales
This is the most common ROI error. Say a new espresso machine lets a café sell 40 more drinks a day at $5.50. That's $80,000 a year of extra revenue, but each drink carries about $1.27 of variable cost. The real gain is the contribution margin: 40 × $4.23 × 365 ≈ $61,760. If the extra volume also needs a part-time barista, subtract that too. Our contribution margin guide shows how to work out the per-unit figure.
Worked example 1: equipment ROI
A bakery is considering a new deck oven for $18,000 installed. It will let them take on wholesale orders that add about $9,000 a year of contribution margin after ingredients, packaging and the extra power the oven uses. They plan to use it for three years and expect to sell it for $3,000 at the end.
- Total gain = 3 × $9,000 + $3,000 resale = $30,000
- ROI = ($30,000 − $18,000) ÷ $18,000 × 100 = 66.7%
- Payback period = $18,000 ÷ $9,000 = 2 years
That looks strong, but 66.7% over three years isn't 66.7% a year. To compare it with a loan rate or another option, annualize it.
Try it — the bakery's oven
ROI on hiring an employee
Hiring is an investment too, and the same formula applies. An HVAC company plans to add a second technician. The fully loaded cost is about $75,000 a year: wages plus payroll taxes, workers' compensation and benefits. Equipping them adds roughly $18,000 a year for a leased van, tools, insurance and phone. If the technician bills 1,400 hours at $125, that's $175,000 of revenue. After $40,000 of parts and materials, the hire adds $135,000 of contribution.
- Gain after the technician's own cost: $135,000 − $75,000 − $18,000 = $42,000
- ROI on the $93,000 yearly outlay = $42,000 ÷ $93,000 = 45%
The catch is ramp-up. New hires rarely bill full hours in their first quarter, so model year one at a lower utilization, say 1,100 hours. At that level, with parts costs falling in line with hours, the gain drops to about $13,000 and the ROI to around 14%. That's still positive, but it shows why cash reserves matter when you grow headcount.
Annualized ROI: comparing investments of different lengths
Annualized ROI = ((final value ÷ initial investment)^(1 ÷ years) − 1) × 100
This is the compound annual growth rate (CAGR) of the investment. For the oven: ($30,000 ÷ $18,000)^(1/3) − 1 = 18.6% a year.
Simply dividing the total ROI by the number of years gives 66.7% ÷ 3 = 22.2%, which overstates the yearly return, because it ignores compounding. The gap grows with time. A 50% return over two years is 22.5% a year compounded, not 25%.
Annualizing matters most when you're choosing between options of different lengths:
| Option | Cost | Total value back | Years | Total ROI | Annualized ROI |
|---|---|---|---|---|---|
| Deck oven | $18,000 | $30,000 | 3 | 66.7% | 18.6% |
| Delivery van upgrade | $40,000 | $58,000 | 5 | 45.0% | 7.7% |
| Website rebuild | $8,000 | $11,000 | 1 | 37.5% | 37.5% |
The website has the lowest total ROI but the highest yearly return, and it frees the cash after one year. If the bakery's equipment loan costs 9% a year, the van barely clears the cost of financing it.
One caveat: annualized ROI treats all the money as arriving at the end. When cash comes back in yearly instalments, as with the oven, the internal rate of return (IRR) is more precise. A spreadsheet's IRR function handles it. For most small purchases, annualized ROI plus payback period is close enough to rank your choices.
Payback period: how fast you get your cash back
Payback period = initial cost ÷ yearly cash gain
Payback ignores what happens after you've recovered the cost, but it answers the question cash-strapped owners care about most: how long is my money tied up? Many small businesses set a rule, for example "equipment must pay back within 3 years" or "a marketing channel must pay back within 6 months of customer revenue."
When gains are uneven, add them up year by year until they equal the cost. If a $12,000 point-of-sale upgrade saves $3,000 in year one, $5,000 in year two and $6,000 in year three, payback comes during year three: $4,000 is still needed after year two, and $4,000 ÷ $6,000 = 0.67, so about 2.7 years.
Cost-saving investments
ROI works the same for spending that cuts costs instead of adding sales. Savings are your gain. A small manufacturer considering a $60,000 rooftop solar system that cuts its power bill by $8,400 a year has a simple payback of $60,000 ÷ $8,400 = 7.1 years. Over a 10-year horizon the savings total $84,000, a total ROI of 40% before maintenance and financing. Long-lived projects like this are where IRR, financing costs, incentives and depreciation make the biggest difference, so get a full quote-based analysis before you commit.

Marketing ROI and ROAS
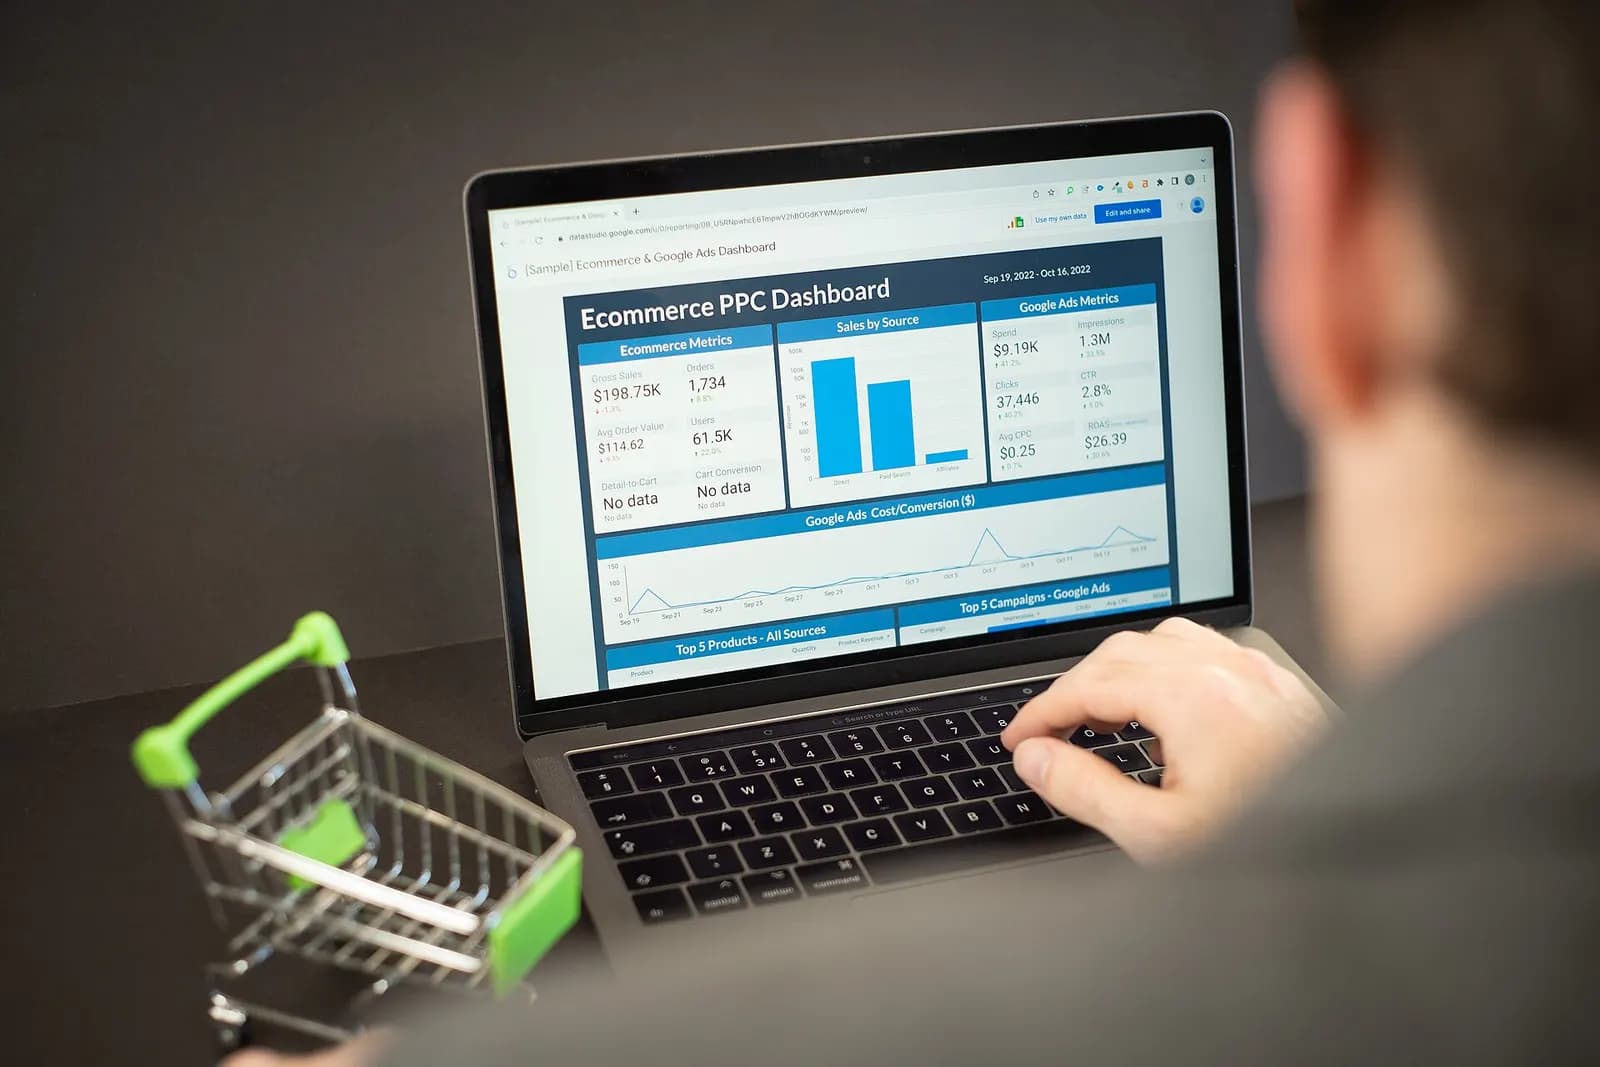
Ad platforms report ROAS, return on ad spend. Google Ads defines its target as the average conversion value (for example, revenue) you want for each dollar spent on ads, calculated as conversion value ÷ ad spend × 100%. ROAS is useful for managing campaigns, but it's a revenue measure. To know whether ads make money, convert it into marketing ROI.
Worked example. An online home-goods store spends $5,000 on search ads in a month and tracks $21,000 of sales from those ads. Its gross margin (after product cost, shipping and payment fees) is 40%.
- ROAS = $21,000 ÷ $5,000 = 4.2× (420%)
- Gross profit from ad sales = $21,000 × 40% = $8,400
- Marketing ROI = ($8,400 − $5,000) ÷ $5,000 = 68%
- Break-even ROAS = 1 ÷ gross margin = 1 ÷ 0.40 = 2.5×. Below that, every ad dollar loses money
Try it — is the campaign profitable?
Three adjustments make marketing ROI more honest:
- Count all marketing costs. Agency or freelancer fees, creative production and tools belong in the cost, not just the platform invoice.
- Include repeat purchases carefully. If a typical new customer buys three times a year, the first order understates the return. Use real repeat rates from your own data, not hopes.
- Separate incremental sales. Some buyers who clicked an ad would have bought anyway, especially on searches for your own brand name. If you can, test pausing a campaign in one region or week and compare.
How to calculate profit margin
ROI looks at a single investment. Profit margin looks at the whole business, or a product, and asks how much of each sales dollar you keep. The general formula is:
Profit margin = profit ÷ revenue × 100
There are three versions, depending on which profit line you use.
- Gross profit margin = (revenue − cost of goods sold) ÷ revenue. COGS covers the direct cost of what you sold. For a sole proprietor it's built on Schedule C from beginning inventory, purchases, labor, materials and other costs, less ending inventory.
- Operating profit margin = operating profit ÷ revenue, where operating profit is gross profit minus operating expenses such as rent, salaries, marketing and depreciation.
- Net profit margin = net income ÷ revenue, after interest and income taxes.
Worked example: a specialty retail store
| Line | Amount | Margin |
|---|---|---|
| Revenue | $480,000 | — |
| Cost of goods sold | −$264,000 | — |
| Gross profit | $216,000 | 45.0% |
| Operating expenses (rent, wages, marketing, depreciation) | −$168,000 | — |
| Operating profit | $48,000 | 10.0% |
| Interest | −$6,000 | — |
| Income taxes | −$9,000 | — |
| Net income | $33,000 | 6.9% |
Each margin points to different fixes. A weak gross margin says prices are too low or product costs too high. A healthy gross margin but weak operating margin points to overhead. A gap between operating and net margin usually comes down to debt costs or entity and tax choices.
Profit margin on a single job or service
Service businesses often find job-level margin more useful than company-wide margin. Take a plumbing job quoted at $1,200. Materials cost $280 and the technician spends 6 hours at a loaded labor cost of $45 an hour ($270). Gross profit on the job is $1,200 − $280 − $270 = $650, a 54% gross margin. If the firm's overhead rate is $20 per labor hour, the job also has to carry $120 of overhead, leaving $530, or about 44%, toward owner pay and profit. Tracking this for every job shows which job types, customers and technicians really make money. It also shows which ones look busy but barely cover their costs.
Margin vs markup
Margin and markup use the same profit but divide by different numbers. Margin divides by the selling price. Markup divides by cost. An item that costs $60 and sells for $100 earns $40: a 40% margin but a 66.7% markup. If you want a 40% margin and add a 40% markup to cost instead, you'll price at $84 and earn only a 28.6% margin.
Try it — margin and markup on one item
What's a good profit margin in 2026?
Margins vary widely by industry. NYU Stern's January 2026 data on US public companies shows average net margins of about 9.4% for restaurants, 5.6% for general retail, 1.3% for grocery and 25.5% for application software. Gross margins range from about 26% in grocery to about 72% in software. These are large listed companies, so treat them as rough context. Your best benchmark is your own trend over the last three years and peers of your size, which an industry association or your accountant can often provide.
ROI, profit margin and the DuPont link
Margin and ROI connect through the DuPont split. ROI = profit margin × asset turnover. The retail store above earns $48,000 of operating profit on $480,000 of sales (10% margin). If it has $200,000 tied up in inventory, fixtures and equipment, its asset turnover is $480,000 ÷ $200,000 = 2.4, and its return on those assets is 10% × 2.4 = 24%.
That gives the owner two levers. Raise margin with better pricing or lower costs, or raise turnover by carrying less slow-moving stock for the same sales. Cutting inventory to $160,000 with no loss of sales lifts turnover to 3.0 and the return to 30% without changing a single price.
A related test, residual income, asks whether an investment beats a minimum required return in dollars. If you require 15% on a $100,000 project and it earns $12,000, residual income is $12,000 − $15,000 = −$3,000. It falls short even though it's profitable.
Common ROI and margin mistakes
- Using revenue as the return. Always convert to profit or savings.
- Leaving out costs. Installation, training, maintenance, financing and your own time all count.
- Ignoring time. Annualize, and check payback against your cash runway.
- Counting sunk costs. Money already spent and unrecoverable shouldn't sway a new decision. Compare only future costs and gains.
- Confusing margin and markup when setting prices.
- Forgetting taxes. After-tax returns can differ from pre-tax ones, especially when an asset qualifies for Section 179 or bonus depreciation, which pulls deductions forward. See our depreciation guide.
What to do next
Write down the next three things you're thinking of spending on, then run each through the ROI calculator using profit or savings, not sales. Rank them by annualized ROI and payback. For ad campaigns, check your break-even ROAS with the ROAS calculator before scaling spend. If your margins look thin, start with contribution margin to see which products and channels carry the business, and use EBITDA when a lender or buyer asks how the whole company performs. If the investment needs financing, compare its annualized ROI with the rates in our startup business loans guide.
Frequently asked questions
ROI = (gain from the investment − cost of the investment) ÷ cost of the investment × 100. If you spend $18,000 on an oven and it brings in $30,000 of extra profit and resale value over its life, your ROI is ($30,000 − $18,000) ÷ $18,000 = 66.7%. Use the profit the investment adds, not the revenue.
It depends on risk and time. A useful floor is the return you could get elsewhere with similar risk, plus a margin for effort and uncertainty. Many owners want equipment to pay back within two to three years. Compare the annualized ROI with your borrowing rate: an investment earning less per year than your loan costs destroys value.
Profit margin = profit ÷ revenue × 100. Use gross profit (revenue minus cost of goods sold) for gross margin, operating profit for operating margin, and net income after interest and taxes for net margin. A business with $480,000 of sales and $33,000 of net income has a net profit margin of 6.9%.
ROAS (return on ad spend) divides the revenue from ads by the ad spend, so $21,000 of sales from $5,000 of ads is a ROAS of 4.2, or 420%. ROI uses profit instead of revenue. At a 40% gross margin, that same campaign earns $8,400 of gross profit, so its marketing ROI is ($8,400 − $5,000) ÷ $5,000 = 68%.
Annualized ROI = ((final value ÷ initial investment)^(1 ÷ years) − 1) × 100. It converts a total return over several years into a yearly rate so you can compare investments of different lengths. A 66.7% total return over three years works out to about 18.6% a year, not 22.2%, because of compounding.
No. Margin is profit as a percentage of the selling price. Markup is profit as a percentage of cost. An item that costs $60 and sells for $100 has a $40 profit, a 40% margin and a 66.7% markup. Confusing them is a common pricing error that leaves prices lower than intended.
Sources & verification
Figures on this page were checked against the sources below when it was last reviewed on 8 October 2026. Each rate and limit is stored once with its own official source and review date, and official update channels are monitored daily so changes are picked up. How we verify
- 1.Calculate your startup costs — break-even analysis — U.S. Small Business Administration · accessed 8 October 2026
- 2.Publication 334 (2025), Tax Guide for Small Business — IRS · accessed 8 October 2026
- 3.About Schedule C (Form 1040), Profit or Loss from Business — IRS · accessed 8 October 2026
- 4.12.3 Evaluate an operating segment or a project using ROI, residual income and EVA — OpenStax (Rice University), Principles of Accounting Vol. 2 · accessed 8 October 2026
- 5.About Target ROAS bidding — Google Ads Help · accessed 8 October 2026
- 6.Margins by sector (US), January 2026 — NYU Stern — Aswath Damodaran · accessed 8 October 2026
- 7.Publication 946 (2025), How To Depreciate Property — IRS · accessed 8 October 2026
MSMETOOLS is an independent platform and is not affiliated with any government agency, ministry or department.
Tools for this
ROI Calculator
Calculate return on investment for your business projects.
ROAS Calculator
Measure return on ad spend and break-even ROAS.
Profit Margin Calculator
Calculate profit, markup and margin for your products or services.
Markup Calculator
Turn cost and markup into a selling price.
Related guides
 EBITDA Meaning (2026): Formula, Margin & Worked ExampleRead guide
 Contribution Margin Meaning (2026): Formula, Ratio & ExamplesRead guide
 How to Calculate ROAS (2026): Formula & Break-Even ROASRead guide
 Depreciation Meaning (2026): Methods, MACRS & Section 179Read guide
Official links open the government site in a new tab.