 Finance & accounting
How to Calculate Cap Rate: Formula, NOI and a Worked Commercial Property Example (2026)
How to calculate cap rate in 2026: the formula, building NOI line by line, a worked $1.65M retail example, cap rate vs cash-on-cash vs ROI, and its limits.
 Edited by Sumeet YadavFounder & editor, MSMETOOLS · fact-checked against official sources
Contents (10)
- 1. What cap rate means
- 2. The cap rate formula
- 3. How to calculate net operating income (NOI)
- 4. Worked example: a six-unit retail center
- 5. Cap rate vs cash-on-cash return vs ROI
- 6. What is a good cap rate in 2026?
- 7. Cap rates by property type and risk
- 8. Limitations of cap rate
- 9. Common mistakes when calculating cap rate
- 10. What to do next
If you're looking at a small commercial building — a six-unit retail strip, a medical office, a flex warehouse or a small apartment block — the first number any broker, lender or appraiser will quote is the cap rate. This guide shows you how to calculate it yourself instead of trusting the listing: the formula, how to build net operating income line by line (where most mistakes happen), a fully worked example on a $1.65 million retail center, how to turn a market cap rate into a value, and how cap rate differs from cash-on-cash return and ROI. Market figures are dated and sourced so you know how current they are.
Quick answer
Cap rate = net operating income ÷ purchase price (or value) × 100. Net operating income (NOI) is a year's rent and other income, minus vacancy and all operating expenses, but before mortgage payments, depreciation and income tax. A property with $113,000 of NOI bought for $1,650,000 has a cap rate of 6.85%.
Use realistic, verified income and expenses — not the seller's 'pro forma'
Include vacancy, management and reserves even if the owner self-manages
Value = NOI ÷ market cap rate — small cap-rate changes move price a lot
Cap rate ignores your loan; use cash-on-cash return to see the effect of debt
Compare cap rates only between similar properties in similar markets at the same time
What cap rate means
The capitalization rate is the one-year return a property would produce if you bought it with all cash. It answers a simple question: for every dollar paid, how many cents of operating income does the building generate each year? A 6.85% cap rate means about 6.85 cents of NOI per dollar of price.
Because it strips out financing and taxes, cap rate lets you compare buildings on equal terms. Two investors buying the same property with different loans will have very different personal returns, but the property's cap rate is the same for both. That's why appraisers, brokers and lenders use it as the shared language of commercial real estate. CBRE, for example, defines its survey cap rate as stabilized NOI divided by acquisition price.
Cap rate also works in reverse. Investors don't just compute it from a price — they use the cap rates on recent sales to set prices. If similar buildings nearby are trading at 7%, a seller can expect buyers to value their building at roughly its NOI divided by 0.07. That's the "income approach" to valuation in its simplest form.
The cap rate formula
From rent to cap rate
Step 1
Gross potential rent
Step 2
− Vacancy & credit loss
Step 3
+ Other income
Step 4
= Effective gross income
Step 5
− Operating expenses
Step 6
= NOI
Step 7
NOI ÷ price
= cap rate
Written out:
Cap rate (%) = Net operating income ÷ Current market value (or purchase price) × 100
And rearranged:
- Value = NOI ÷ cap rate — what a building is worth at a given market cap rate.
- NOI = value × cap rate — the income a buyer needs to see to justify a price.
The arithmetic is trivial. The hard part is getting NOI right, because a $5,000 error in NOI at a 7% cap rate is a $71,000 error in value.
How to calculate net operating income (NOI)
NOI is income minus operating expenses, measured over 12 months. Build it in four steps.
1. Gross potential rent (GPR). The rent you'd collect if every unit were leased at market or contract rent for the full year. Use the rent roll and signed leases, not asking rents.
2. Vacancy and credit loss. Subtract an allowance for empty units and tenants who don't pay. Even a fully leased building needs one, because leases end and tenants fail. Use the building's history and the local market vacancy rate; 5% is a common starting assumption for a stable small retail or office property, higher for older buildings or weaker locations.
3. Other income. Add recurring non-rent income: parking, signage, laundry, storage, late fees and expense reimbursements from tenants under net leases (CAM, tax and insurance recoveries). The result is effective gross income (EGI).
4. Operating expenses. Subtract every cost of running the building: property taxes, insurance, repairs and maintenance, utilities the landlord pays, landscaping and snow removal, janitorial for common areas, property management, legal and accounting, and a replacement reserve for roofs, parking lots and HVAC units that wear out.
What you leave out matters as much:
- Mortgage principal and interest (financing, not operations)
- Depreciation (a tax deduction, not a cash cost)
- Income taxes
- Major one-off capital improvements, such as a full renovation (the reserve covers routine replacement)
- The owner's personal expenses run through the property
Sellers' marketing packages often show NOI with no management fee ("owner self-manages"), no reserves and a vacancy rate of zero. Put those costs back. A buyer — and a lender — will.
Worked example: a six-unit retail center
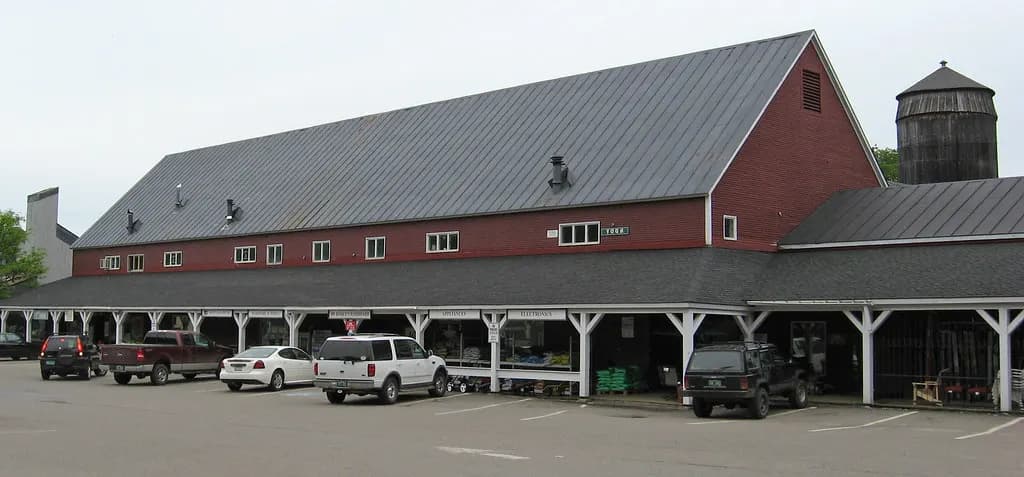
Here's a realistic small-investor deal. Maple Plaza is a six-unit neighborhood retail center listed at $1,650,000. Each unit leases for $2,500 a month on modified-gross leases, so the landlord pays most operating costs. All figures are illustrative.
| Line | Annual amount | Notes |
|---|---|---|
| Gross potential rent | $180,000 | 6 units × $2,500 × 12 |
| Vacancy and credit loss (5%) | −$9,000 | Based on building history |
| Other income | $3,000 | Pylon-sign panels |
| Effective gross income | $174,000 | |
| Property taxes | −$21,000 | From the county tax bill |
| Insurance | −$8,500 | Quote for the new owner |
| Repairs and maintenance | −$9,000 | Trailing 3-year average |
| Property management (5% of EGI) | −$8,700 | Even if you self-manage |
| Common-area utilities | −$6,000 | Lighting, water |
| Landscaping and snow removal | −$4,800 | Service contracts |
| Replacement reserves | −$3,000 | Roof, parking lot, HVAC |
| Total operating expenses | −$61,000 | 35% of EGI |
| Net operating income | $113,000 |
Cap rate = $113,000 ÷ $1,650,000 = 6.85%.
Now suppose the listing package showed NOI of $125,500 because it left out management and reserves and assumed zero vacancy. At the asking price that looks like a 7.6% cap rate — a full 0.75 percentage points better than reality. Rebuilding NOI yourself is the single most useful thing you can do on any deal.
Valuing the property from a market cap rate
Say your broker shows you three recent sales of similar neighborhood centers in the same county at cap rates of 7.0%, 7.25% and 7.5%. Using the middle figure:
- Value at 7.25% = $113,000 ÷ 0.0725 ≈ $1,558,600
- At 7.0%: ≈ $1,614,300
- At 6.5%: ≈ $1,738,500
The asking price of $1,650,000 implies a 6.85% cap rate, which is lower (more expensive) than any of the comps. That doesn't mean walk away — maybe Maple Plaza has longer leases or a stronger anchor tenant — but you now know the seller is pricing it at a premium and you know what you'd need to believe to pay it.
Try it — net yield (cap rate) on Maple Plaza
In the calculator above, "monthly rent" is set to $15,250 — the $183,000 a year of rent plus other income before vacancy — and "annual expenses" is $70,000, the $9,000 vacancy allowance plus $61,000 of operating costs, so the net yield it shows works out the same way as a cap rate. Change any input to test your own deal.
Cap rate vs cash-on-cash return vs ROI
These three are often confused, but each answers a different question. Using Maple Plaza with a typical loan shows the difference clearly.
Assume: 30% down ($495,000) plus $35,000 of closing costs, so $530,000 of your own cash. A $1,155,000 loan at an illustrative 7.0% interest rate, amortized over 25 years, costs about $97,960 a year in principal and interest.
- Cap rate: $113,000 ÷ $1,650,000 = 6.85% (unlevered, ignores the loan)
- Cash-on-cash return: NOI $113,000 − debt service $97,960 = $15,040 pre-tax cash flow; ÷ $530,000 = 2.8%
- First-year ROI (total return on your cash): cash flow $15,040 + principal paid down about $17,670 + 2% appreciation $33,000 = $65,710; ÷ $530,000 = about 12.4%. Without the appreciation assumption it's about 6.2%.
Three return measures on the same building
| Measure | Formula | Includes the loan? | Maple Plaza (year 1) |
|---|---|---|---|
Cap rate | NOI ÷ price | No | 6.85% |
Cash-on-cash return | Pre-tax cash flow after debt service ÷ cash invested | Yes | 2.8% |
ROI (total return) | (Cash flow + principal paydown + appreciation) ÷ cash invested | Yes | ≈ 12.4% (≈ 6.2% without appreciation) |
All-cash cash-on-cash | NOI ÷ (price + closing costs) | No loan | 6.7% |
Cap rate
- Formula
NOI ÷ price
- Includes the loan?
No
- Maple Plaza (year 1)
6.85%
Cash-on-cash return
- Formula
Pre-tax cash flow after debt service ÷ cash invested
- Includes the loan?
Yes
- Maple Plaza (year 1)
2.8%
ROI (total return)
- Formula
(Cash flow + principal paydown + appreciation) ÷ cash invested
- Includes the loan?
Yes
- Maple Plaza (year 1)
≈ 12.4% (≈ 6.2% without appreciation)
All-cash cash-on-cash
- Formula
NOI ÷ (price + closing costs)
- Includes the loan?
No loan
- Maple Plaza (year 1)
6.7%
The lesson: when your loan interest rate is higher than the cap rate, borrowing actually reduces your cash yield — this is called negative leverage. Here the loan costs 7.0% interest while the property yields 6.85%, so every borrowed dollar earns less than it costs, and cash-on-cash drops to 2.8%. Investors accept that only if they expect rents and values to grow. Lenders will notice too: NOI covers debt service only about 1.15 times in this example, and many commercial lenders want a higher coverage ratio, which would shrink the loan and raise the cash you need. Use our ROI calculator and loan payment calculator to run the numbers for your own loan terms.
What is a good cap rate in 2026?
A "good" cap rate is a fair one — fair for the property type, the location, the building's condition, the lease terms and today's interest rates. There are two useful reference points.
Recent sales of similar buildings. This is the benchmark that matters most. Ask a broker or appraiser for closed sales (not listings) of the same property type, size and quality in the same market over the last 6–12 months, and calculate their cap rates from verified NOI.
National surveys. CBRE's U.S. Cap Rate Survey for H1 2026, published on 12 August 2026 and based on about 3,600 estimates across more than 50 markets, found the all-property average essentially flat versus late 2025. Neighborhood retail compressed the most, followed by hotel and industrial, while infill multifamily and lower-tier office drew the most bearish views. CBRE's sector tables sit in the full report. For a rough sense of levels, one commercial mortgage lender's Q2 2026 outlook (dated 10 August 2026) put average cap rates at about 5.2% for multifamily and industrial, 6.7% for retail and 7.9% for Class B/C office. Treat those as secondary estimates, not official data — they vary widely by market and building class.
Cap-rate context, autumn 2026
5.27%
10-year Treasury yield
6 Oct 2026, FRED/H.15
Flat
CBRE all-property cap rate, H1 2026 vs H2 2025
published 12 Aug 2026
≈ 6.7%
Indicative retail average, Q2 2026
secondary lender estimate
6.85%
Maple Plaza at asking price
worked example
The Treasury spread. Investors compare cap rates with the 10-year Treasury yield, which was 5.27% on 6 October 2026. The gap — Maple Plaza's 6.85% minus 5.27% is about 1.6 percentage points — is the extra annual return for owning a building instead of a risk-free bond. When Treasury yields rise and cap rates don't, that cushion thins, which is why higher rates tend to push cap rates up and values down over time.
Cap rates by property type and risk
Cap rates differ because risk differs. In general, expect lower cap rates (higher prices) for:
- Newer buildings in large, growing metros
- Long leases to creditworthy tenants, especially triple-net (NNN) leases where tenants pay taxes, insurance and maintenance
- Property types investors currently favor, which in recent years has meant industrial and apartments
And higher cap rates for:
- Older buildings needing capital work
- Short leases, many small local tenants or a single tenant with weak credit
- Smaller or slower-growing markets
- Property types facing structural headwinds, such as lower-tier office
A one-percentage-point difference matters enormously. On $113,000 of NOI, the gap between a 6% cap rate and a 7% cap rate is about $269,000 of value. That's why negotiations so often come down to arguing over a quarter point.

Limitations of cap rate
Cap rate is a starting point, not a verdict. Keep these blind spots in mind.
It's one year. It captures a single year's NOI, so it misses rent increases, upcoming lease expiries and big expenses due in year three. A building with a 7% cap rate and a major tenant leaving next year may be a worse deal than one at 6% with ten-year leases. For multi-year analysis, use a discounted cash flow or internal rate of return (IRR).
It ignores capital spending. A roof replacement or parking-lot repaving isn't in NOI beyond the reserve. Get a property condition report and budget for capital items separately.
It ignores financing and taxes. That's by design, but your real return depends on both. Depreciation is a big part of the after-tax picture: the IRS lets you depreciate commercial buildings over 39 years and residential rental buildings over 27.5 years, but never the land. None of that shows in the cap rate.
| Cap rate tells you | Cap rate does not tell you |
|---|---|
| Year-one operating yield at a given price | Rent growth, lease expiries or future vacancies |
| How the price compares with similar sales | Capital spending (roof, HVAC, parking lot) beyond reserves |
| A quick value estimate (NOI ÷ market cap rate) | Your return after the loan, taxes and depreciation |
| The market's view of risk for that asset | Whether the NOI you were given is accurate |
It depends entirely on NOI quality. Seller-provided figures, "pro forma" NOI based on future rents, and missing expense lines all inflate the cap rate. Ask for trailing-12-month operating statements, tax bills, insurance quotes and the rent roll, and confirm leases directly.
It isn't comparable across markets or time. A 6% cap rate in a coastal metro and a 6% cap rate in a small town carry different risks, and a 2021 cap rate tells you little about 2026 pricing when interest rates are very different.
Official data and tax references
- FRED — 10-year Treasury yield (DGS10)Daily risk-free benchmark for cap-rate spreads
- Federal Reserve H.15 Selected Interest RatesOfficial source of Treasury constant-maturity yields
- IRS Publication 946 — How to Depreciate PropertyRecovery periods; land not depreciable
- CBRE U.S. Cap Rate Survey H1 2026Survey methodology and sector tables (industry data, not government)
Common mistakes when calculating cap rate
- Using gross rent instead of NOI. That's a gross yield, not a cap rate — it can overstate return by a third or more.
- Subtracting mortgage payments. Debt service never goes in NOI. If you subtract it, you're calculating something closer to cash flow.
- Forgetting vacancy, management and reserves. Even owner-managed, fully leased buildings need all three.
- Using the old owner's property taxes. In many states a sale triggers a reassessment, so taxes can jump after you buy. Estimate them on your purchase price.
- Mixing up price and value. Cap rate on purchase price tells you your entry yield; cap rate on current value tells you today's market yield. Be clear which you're using.
- Comparing a stabilized cap rate with a value-add one. A half-empty building priced on its future NOI isn't comparable to a fully leased one priced on today's NOI.
What to do next
Gather the trailing-12-month operating statement, rent roll and tax bill for the property you're considering, rebuild NOI line by line using the table above, and calculate the cap rate on the asking price. Then compare it with recent local sales and with the current 10-year Treasury yield, and run your financing through the ROI calculator to see your cash-on-cash return. If you'll be financing an owner-occupied building, our guide to SBA loan requirements explains how lenders size commercial real estate loans, and the EBITDA guide covers the equivalent "operating income" measure for valuing a business rather than a building.
This is general information, not financial, legal or tax advice — confirm figures with the official source or a qualified professional before you invest.
Frequently asked questions
Cap rate = net operating income (NOI) ÷ property value or purchase price × 100. NOI is the property's yearly income after vacancy and operating expenses but before mortgage payments, depreciation and income tax. A building producing $113,000 of NOI that sells for $1,650,000 has a cap rate of 6.85%.
There's no single good number. A good cap rate is one that fairly pays you for the property's risk compared with similar buildings nearby and with safer alternatives like Treasury bonds. Stable, well-leased buildings in strong markets trade at lower cap rates; older, riskier or smaller-market properties trade higher. Compare against recent sales of the same property type in the same market.
No. Cap rate ignores financing entirely, which is what makes it useful for comparing properties regardless of how each buyer pays. Debt service, loan fees and interest are left out of NOI. To see how a loan changes your return, use cash-on-cash return, which divides pre-tax cash flow after debt service by the cash you actually invested.
Rearrange the formula: value = NOI ÷ cap rate. If a building's NOI is $113,000 and similar properties are selling at a 7.25% cap rate, its indicated value is $113,000 ÷ 0.0725 ≈ $1,558,600. A small change in the cap rate moves value a lot — at 6.5% the same NOI implies about $1,738,500.
For a buyer, a higher cap rate means more income per dollar paid, but usually because the market sees more risk — weaker tenants, shorter leases, older buildings or a slower market. For a seller, a lower cap rate means a higher price. Higher isn't automatically better; it's only better if the extra risk is smaller than the market assumes.
Cap rate is a one-year, unlevered snapshot: NOI divided by price. ROI is a broader measure of everything you earn on your own cash over the holding period — cash flow, loan principal paid down and appreciation — divided by what you invested. The same building can have a 6.85% cap rate, a 2.8% first-year cash-on-cash return and a 12% first-year ROI.
Sources & verification
Figures on this page were checked against the sources below when it was last reviewed on 8 October 2026. Each rate and limit is stored once with its own official source and review date, and official update channels are monitored daily so changes are picked up. How we verify
- 1.U.S. Cap Rate Survey H1 2026 — CBRE · accessed 8 October 2026
- 2.Market Yield on U.S. Treasury Securities at 10-Year Constant Maturity (DGS10) — Federal Reserve Bank of St. Louis (source: Board of Governors, H.15) · accessed 8 October 2026
- 3.Publication 946, How To Depreciate Property — Internal Revenue Service · accessed 8 October 2026
- 4.Selected Interest Rates (H.15) — Board of Governors of the Federal Reserve System · accessed 8 October 2026
- 5.Q2 2026 Cap Rate Outlook Report / Cap rates glossary — Apartment Loan Store (commercial mortgage lender) · accessed 8 October 2026
- 6.Capitalization rate — Wikipedia · accessed 8 October 2026
MSMETOOLS is an independent platform and is not affiliated with any government agency, ministry or department.
Tools for this
Rental Yield Calculator
Calculate gross and net rental yield.
ROI Calculator
Calculate return on investment for your business projects.
EMI Calculator
Calculate loan EMIs for business and personal loans.
Business Valuation Calculator
Estimate what your business is worth.
Related guides
 Net Profit Margin (2026): Formula, Benchmarks & ExamplesRead guide
 How to Calculate ROI (2026): Formula, Examples & MarginsRead guide
 How to Calculate ROAS (2026): Formula & Break-Even ROASRead guide
 How to Price Your Services (2026): Hourly, Project or ValueRead guide
Official links open the government site in a new tab.